Imagine this, two traders start trading Bitcoin on the same day. One makes consistent, calculated entries and exits, doubling their portfolio in a few months. The other jumps in based on tweets and gut feelings and ends up getting losses. What’s the difference? One uses trading technical analysis . The other just guesses. The Kenyan crypto scene is growing fast, with more young investors diving into platforms like Binance, KuCoin and Paxful. But most beginners rely on hype or luck not strategy. Without a clear system for analysing price action, many traders fall into emotional decisions, buying tops and panic-selling bottoms.
That’s where trading technical analysis comes in. It’s the skill of reading charts, identifying patterns and using indicators to predict market moves, not perfectly, but with an edge. Whether you’re holding Bitcoin, trading altcoins, or exploring DeFi tokens, TA helps you trade smarter, not harder. This guide will walk you through the essential tools, strategies, and tips to get started even if you’ve never read a chart before.
What is technical analysis in cryptocurrency
Technical analysis (TA) is a method used by crypto traders to forecast price movements by analysing historical data, mainly price and volume. Traders use this to predict future market prices and aim at benefiting from the analysis of the trends of the market. Trading technical analysis in Kenya can also be used in forex and cryptocurrency trading, i.e., forex technical analysis, cryptocurrency technical analysis, etc. Unlike fundamental analysis, which looks at the coin’s value, TA focuses on patterns and indicators to make informed trading decisions.
Why it matters
Trading technical analysis in cryptocurrency matters because of the volatility of the market. Prices can swing dramatically within minutes. This makes timing crucial and technical analysis helps traders to identify the entry and exit points based on historical price data. By studying patterns in price movements, traders can spot trends and make more informed predictions about where the market might go next.
For crypto traders, mastering trading technical analysis in Kenya means gaining a strategic edge. Instead of relying on risky tips or emotionally charged decisions, TA allows you to trade based on logic, patterns and probabilities. Whether you’re scalping short-term moves or holding long-term positions, understanding technical analysis can help you reduce losses and make smarter, data-backed trading choices.
Trading technical analysis vs. fundamental analysis
Technical analysis (TA) and Fundamental analysis (FA) are two different approaches to evaluating cryptocurrencies. Technical analysis in Kenya focuses on price charts and market data to predict short-term price movements. It uses tools like candlestick patterns, support and resistance levels, and indicators such as RSI and MACD to help traders identify trends and potential entry or exit points. TA assumes that all relevant information is already reflected in the current price, making it especially useful for active traders looking to profit from short-term market movements.
On the other hand, fundamental analysis looks at the underlying value of a cryptocurrency. It examines factors like the project’s use case, team, technology, tokenomics, community support and real-world adoption. FA is more concerned with long-term potential and is commonly used by investors who want to determine whether a coin is worth holding over time. In practice, many smart traders combine both approaches, using FA to choose strong projects and TA to time their trades effectively.
How trading technical analysis in Kenya is used
Crypto trading is growing fast in Kenya and many traders are using technical analysis to make smarter decisions. By studying charts, price trends and patterns, you can predict market movements and reduce risky guesses. Below is a break down of how trading technical analysis in Kenya works and how you can use it effectively in the Kenyan crypto scene.
-
Timing entry and exits in volatile markets
Crypto prices can swing rapidly, about 10-20% in hours. Through trading technical analysis , Kenyan traders can know when to buy and sell high, avoiding panic decisions. An example of this is when using RSI to spot when Bitcoin is oversold before buying through a platform like Binance P2P.
-
Spotting Trends for Better Investment Decisions
In the cryptocurrency market, TA helps traders to know whether a certain coin is rising or falling. This helps them to make an informed decision based on the analysis and in most cases, traders don’t want to invest during a downturn unless they know a reversal is coming. This is useful for long-term holders of BTC, ETH and others.
-
Understanding Support and Resistance for Mobile Trading
Most Kenyan traders use their mobile app due to the easy access of smartphones. Support and resistance levels are easy to analyse even on a small screen, guiding when to enter or exit trades.
-
Risk Management for Small Capital Traders
Many Kenyan traders start small and technical tools like stop-losses based on chart levels can protect small capital from big losses.
-
Using Patterns to Predict Price Moves
Trading technical analysis in Kenya helps traders use common patterns like head and shoulders, flags or double bottoms to signal potential breakdowns.
Core concept of trading technical analysis in Kenya
I. Candlestick Charts. The Language of Price
One of the fundamental understandings necessary to learning technical analysis is the ability to read candlestick charts. Each ‘’candle’’ on the chart shows how price moved within a specific time frame. It is important to note that a candlestick has four key data points. That is
- Open: The price when the candle period begins
- High: The highest price reached during that time
- Low: The lowest price reached
- Close: The final price when the candle period ends
- The colour of the candle typically indicates whether the price went up (often green or white) or down (often red or black) during that period. Learning to recognize common candlestick patterns. Here is a more detailed explanation of candlesticks.
Key Candlestick Patterns
1) Doji Family (Indecision/Reversal Signals)
The doji family refers to a group of candlestick patterns on a price chart that all share one key characteristic: the open and close prices are nearly the same, resulting in a candle that looks like a cross, plus sign, or inverted “T.” These patterns represent indecision in the market and can signal a possible trend reversal, especially when seen after a strong trend. They include
- Standard Doji: Open and close are nearly identical, showing strong indecision. Often signals a potential reversal at market tops or bottoms.
- Long-Legged Doji: Open and close are near the middle of the candle, but with very long upper and lower wicks on both ends. They reflect extreme indecision and significant price swings.
- Gravestone Doji: Open, low and close are near the bottom of the candle, with a long upper wick. Appears after uptrends and signals a bearish reversal.
- Dragonfly Doji: Open, high, and close are near the top of the candle, with a long lower wick. Appears after downtrends and signals a bullish reversal.
- Key Tip: Doji patterns are more meaningful when they appear after a strong trend, not in sideways markets. Always consider the context.
Always look for doji when it comes to trading technical analysis in Kenya. They are more meaningful when they appear after a strong trend, not in sideways markets. Always consider the context. Understanding these patterns as a trader helps you to anticipate possible price reversals or continuations.
2) Hammer candlestick
A hammer is a single candlestick that appears after a downtrend and suggests a potential positive reversal. It has a small real body near the top of the candle and a long lower shadow, indicating that sellers pushed the price lower during the session, but buyers regained control before the close. This indicates high and strong buying pressure and weaker selling momentum among traders, which can signal the beginning of an upward move.
Key Characteristics:
- Appears after a downtrend
- Little or no upper shadow
- Small real body (either colour) near the top
- Long lower shadow
3) Engulfing Candlestick
Unlike the hammer candlestick, this is a two-candle formation that indicates a shift in momentum.
- A bullish engulfing forms at the end of a downtrend when a small bearish candle is followed by a larger bullish candle that completely “engulfs” the previous day’s body.
- A bearish engulfing pattern occurs at the end of an uptrend. A small bullish candle is followed by a larger bearish candle that completely engulfs the previous body, suggesting a potential downward reversal as sellers gain control.
Key Characteristics:
- Two candlesticks in the pattern.
- The second candle’s body completely engulfs the first candle’s body.
- High volume strengthens the signal.
- Most effective after a prolonged trend.
II. Trend Lines and Channels
Trend lines are diagonally lines that are drawn across a price chart to connect important price points, typically highs or lows. They help traders visually know whether the market is on an upward or downward trend.
Channels form when you draw two parallel trend lines, one for highs and one for lows. The price bounces between them, giving traders clear buying and selling zones. they are also important when it comes to technical analysis in cryptocurrency because they provide clear boundaries within which price is likely to move, offering strategic insights for risk management and profit-taking.
Key technical indicators
A) Moving averages (MA)
These are averages of past prices over a period, helping to identify the direction of a trend. MAs also act as dynamic support and resistance levels. It is ideal for trending markets.
Types of Moving averages
There are two types of moving averages.
- Simple moving average—it calculates the average number of prices over a set number of periods.
- Exponential Moving Average (EMA)—This average gives more weight to recent prices, making it more responsive to new information. It is simple to understand and smooth. It is best for identifying trend direction and smoothing price action.
B) Moving Average Convergence Divergence (MACD)
This is a momentum indicator that shows the relationship between two moving averages of a security’s price. They combine momentum and trend analysis. Their signals come when the MACD line crosses above or below the signal line. This makes it ideal for identifying trend direction and momentum shifts. The histogram shows the strength of momentum.
C) Bollinger Bands
This is a volatility indicator consisting of a middle band (a 20-period SMA) and two outer bands (standard deviations above and below the SMA). The band widens during high volatility and tightens during low volatility. Some phrases used in Bollinger bands are
- Overbought—This suggests the asset’s price is relatively high compared to its recent average, and it might be due for a pullback or correction.
- Oversold—This indicates the asset’s price is relatively low, suggesting a potential bounce or upward reversal.
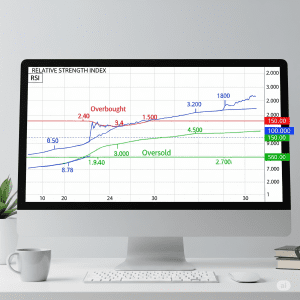
D) Relative Strength Index (RSI)
RSI is a momentum oscillation that tells you if an asset is overbought (too expensive) or oversold (too cheap) based on recent momentum. It ranges from 0 to 100. It helps traders know the best time to sell or buy. Note that above 70, overbought could start falling and below 30, oversold might bounce back. RSI is best for confirming direction after a trend starts.
E) Stochastic Oscillator
Another oscillating indicator in trading technical analysis in cryptocurrency that tells if a price has closed near its recent highs or lows. It compares a security’s closing price to its price range over a given period and ranges from 0 to 100. Note that above 80 overbought might drop and below 20, oversold may rise. It works best in sideways markets or when the price is moving in a range. It is helpful when timing entries and exits.
F) Average True Range (ATR)
This indicator in technical analysis in cryptocurrency tells how much the price is moving or how noisy the market is. It is used to set stop-losses based on current market volatility. A high ATR indicates a high volatility and it does not show the trends.
Chart patterns
Certain chart formations repeat themselves in crypto markets due to trader psychology. Some key chart patterns in trading technical analysis in cryptocurrency include:
- Head and Shoulders: A reversal pattern that can indicate a trend change.
- Double Top/Bottom: Price tries a level twice and fails — a signal of reversal.
- Triangles (symmetrical, ascending, descending): Patterns that often lead to breakout moves.
- Flags and Pennants: Short consolidation periods before price continues in the previous trend direction.
Mastering these chart patterns allows traders to anticipate breakouts and prepare trades in advance
Common Mistakes to Avoid in technical analysis in cryptocurrency
- Relying on One Indicator—Use multiple indicators for confirmation, not just one (e.g., RSI + MACD).
- Ignoring Market News—TA works best when combined with fundamental news and events.
- Overtrading Small Signals—Avoid trading every minor move; focus on strong signals.
- Forcing Patterns—Don’t “see” patterns that aren’t there. Use clear criteria.
No Risk Management—Always use stop-loss and risk only a small portion per trade.- Chasing the Market (FOMO)—Don’t jump in after a big move. Wait for confirmation or pullbacks.
- Ignoring Volume—Volume confirms the strength of price moves. Low volume = weak signal.
- Switching Strategies Too Often—Stick to one tested strategy and refine it.
- No Backtesting—Test your strategy with past data before using real money.
- Emotional Trading—Don’t trade based on fear, greed, or revenge. Follow your plan.
Advantages of trading technical analysis in Kenya
Here are some key pros of trading technical analysis.
1. Data-Driven Decisions
- Trading technical analysis in Kenya relies on historical price data and volume, allowing traders to make decisions based on observable patterns in the market rather than emotions or speculation.
2. Helps Identify Trends
- It enables traders to identify market trends (uptrend, downtrend, or sideways) and align their trades with the prevailing direction, which increases the chances of success.
3. Supports Timing of Entry and Exit
- Technical indicators and chart patterns help pinpoint optimal entry and exit points, improving trade precision and profitability of the trader.
4. Applies to all Markets and Timeframes
- Trading technical analysis in Kenya can be used across any financial market (crypto, stocks, forex, etc.) and on any timeframe (minutes to months), making it very flexible for different trading styles.
5. Useful for Short-Term Trading
- It is particularly valuable for day traders and swing traders who rely on short-term price movements rather than long-term price movements.
6. Visual Simplicity
- Charting tools present information in a visual format, making it easier for traders to spot support and resistance levels, patterns and trends at a glance.
7. Helps with Risk Management
- With tools like stop-loss levels and trend reversals, technical analysis supports effective risk management and helps reduce emotional decision-making.
8. Widely Used and Tested
- Many traders use the same technical tools (e.g., RSI, MACD, moving averages), which can lead to self-fulfilling outcomes, as similar reactions to signals may influence market movements.
Disadvantages of trading technical analysis in Kenya
Although it has its own advantages, trading technical analysis also has its weaknesses. Its cons include
-
Based on Historical Data
TA relies on past price movements and patterns. It assumes history repeats itself, which may not always be true, especially during unexpected market events (e.g., political turmoil, regulation changes).
-
Subjectivity and Interpretation
Different traders may interpret the same chart differently. One person might see a “bullish flag,” while another sees a “bearish reversal.” This subjectivity can lead to inconsistent results.
-
False Signals
Indicators can give false breakouts or signals, especially in volatile or sideways markets. Acting on these signals can lead to losses.
-
Lagging Indicators
Many TA tools (like moving averages and MACD) are lagging, meaning they follow price movements and may give signals after the move has already started.
-
Market Manipulation
In some markets (especially low-volume cryptocurrencies), large players (whales) can manipulate prices, making technical patterns unreliable.
-
Doesn’t Account for Fundamentals
TA ignores company/asset fundamentals (e.g., earnings, news, or economic events), which can significantly affect price direction.
-
Too Many Indicators
Beginners often use too many indicators (indicator overload), leading to analysis paralysis or contradictory signals.
-
Over-Optimization
Backtesting TA strategies on historical data can lead to “curve fitting”—a” strategy that works perfectly on past data but fails in live markets.
-
Emotional Trading
Even with technical strategies, traders can let emotions take over (fear or greed), leading to impulsive decisions against the TA signals.