In the dynamic landscape of online trading, accessing powerful charting tools and market analysis has become essential for trader success. TradingView has risen to prominence globally for its comprehensive suite of analytical features spanning forex, stocks, indices, commodities, and cryptocurrencies. For forex traders in Kenya, mastering TradingView—whether as a standalone platform or through Deriv’s tailored implementation—can significantly enhance trading performance and decision-making capabilities.
This guide offers a detailed examination of the platform’s core functionalities, pricing structure, and comparison with Deriv’s version, while also explaining how Kenyan traders can integrate their existing forex accounts and determine which implementation best aligns with their unique trading approach and objectives.
What is TradingView?
TradingView is a cloud-based financial analysis platform that combines advanced charting tools with a social trading community. Unlike traditional trading software, it allows users to analyze multiple asset classes, including forex pairs, global stocks, indices, futures, and cryptocurrencies, all within a single interface.
One of its key advantages of is its accessibility. Traders can use it directly from a web browser, download the desktop application for Windows or Mac, or access it via mobile apps for iOS and Android. This flexibility makes it an excellent choice for Kenyan traders who need to monitor markets on the go.
Additionally, it fosters a collaborative environment where traders can share insights, publish technical analyses, and follow market experts. This social aspect sets it apart from conventional trading platforms, making it not just a tool for analysis but also a hub for learning and strategy development.
How TradingView Works
TradingView’s interface is designed to be intuitive yet powerful, catering to both beginners and experienced traders. Upon logging in, users are greeted with customizable charts that support multiple timeframes, from one-minute intervals to monthly views. The platform includes over 100 built-in technical indicators, such as moving averages, RSI, MACD, and Bollinger Bands, allowing traders to conduct detailed market analysis.
A standout feature is Pine Script, their proprietary programming language, which enables users to create custom indicators and automated trading strategies. This is particularly useful for traders who rely on algorithmic approaches or wish to backtest their strategies before applying them in live markets.
Another notable functionality is the ability to set price alerts. Traders can configure notifications for specific price levels, trendline breaks, or indicator crossovers, receiving alerts via email, SMS, or pop-up messages. This ensures they never miss a potential trading opportunity, even when away from their screens.
TradingView’s Market Coverage
They supports a vast array of financial instruments, making it a versatile tool for Kenyan traders engaged in different markets.
Forex Trading on TradingView
Forex traders will appreciate the platform’s extensive currency pair coverage, including major, minor, and exotic pairs. Real-time price data, combined with liquidity heatmaps and an integrated economic calendar, provides a comprehensive trading environment. The ability to overlay multiple currency pairs on a single chart also facilitates comparative analysis, helping traders identify correlations and divergences.
Stocks and Indices
For those interested in equities, they also offers access to global stock exchanges, including the Nairobi Securities Exchange (NSE), NYSE, NASDAQ, and LSE. Traders can analyze individual stocks, compare sector performance, and track benchmark indices like the S&P 500 or FTSE 100.
Cryptocurrencies
Cryptocurrency traders benefit from detailed crypto charts, which include spot and futures markets. Features like volume profile analysis and order book data help in assessing market sentiment and liquidity, crucial for making informed trading decisions in the volatile crypto space.
Binary Options via Deriv’s TradingView
While they do not support binary options trading, brokers like Deriv have integrated TradingView’s charting tools into their platforms. This allows traders to analyze binary options markets using TradingView’s advanced charts before executing trades directly within Deriv’s interface.
TradingView Pricing Plans
TradingView offers several subscription tiers, each catering to different levels of trading activity and analytical needs.
The free plan is an excellent starting point for beginners, providing basic charting tools and delayed data for most markets. However, it comes with limitations, such as a restricted number of indicators and alerts.
The Pro plan, priced at $14.95 per month, removes advertisements and increases the number of available indicators and alerts. It is ideal for active traders who require more robust tools without committing to the highest-tier subscription.
For professional traders, the Premium plan at $59.95 per month offers unlimited alerts, real-time data, and priority customer support. This tier is best suited for high-frequency traders and those who rely on ultra-fast market data for their strategies.
Kenyan traders should evaluate their trading frequency and analytical requirements before selecting a plan. While the free version suffices for casual traders, serious investors may find the Pro or Premium plans more aligned with their needs.
How to Get Started With TradingView In Kenya
Getting started with TradingView is simple and accessible for traders of all levels.
First, visit the website and sign up for a free account—no download is required to begin using the web-based platform.
Once registered, explore the intuitive interface by selecting your preferred markets (stocks, forex, crypto, etc.) and customizing charts with technical indicators, drawing tools, and timeframes that suit your strategy.
For enhanced features, consider upgrading to a paid plan (Pro, Pro+, or Premium), which unlocks more indicators, advanced alerts, and real-time data. Download the TradingView desktop or mobile app for seamless trading on the go, and connect your broker (if supported) to execute trades directly from the charts. Whether you’re a beginner or a seasoned trader, TradingView’s powerful tools and social community make it easy to analyze markets and refine your strategies.
How To Navigate TradingView Like a Pro
After signing in, you will be directed to the homepage, where several tabs are available for you to explore. These include:
-
Products: This section provides access to the chart terminal, heat maps, screeners, and a calendar of upcoming economic events.
-
Community: Here, you can view content shared by other traders, including trading ideas, educational posts, and custom scripts for strategies and indicators.
-
Markets: In this tab, you can search for and analyze financial instruments. You can also filter them based on specific financial markets or explore categories like most volatile assets, top gainers, and top losers.
-
Brokers: This section lists all brokers integrated with TradingView. It includes details such as star ratings, active account numbers, and user reviews.
- More: In this section, you will find options to download the Tradingview application, their help center and the about section.
However, for the purpose of this article, we will focus only on the Supercharts feature. To access Supercharts, hover over the “Products” tab and click on “Supercharts.” This will open the main chart terminal.
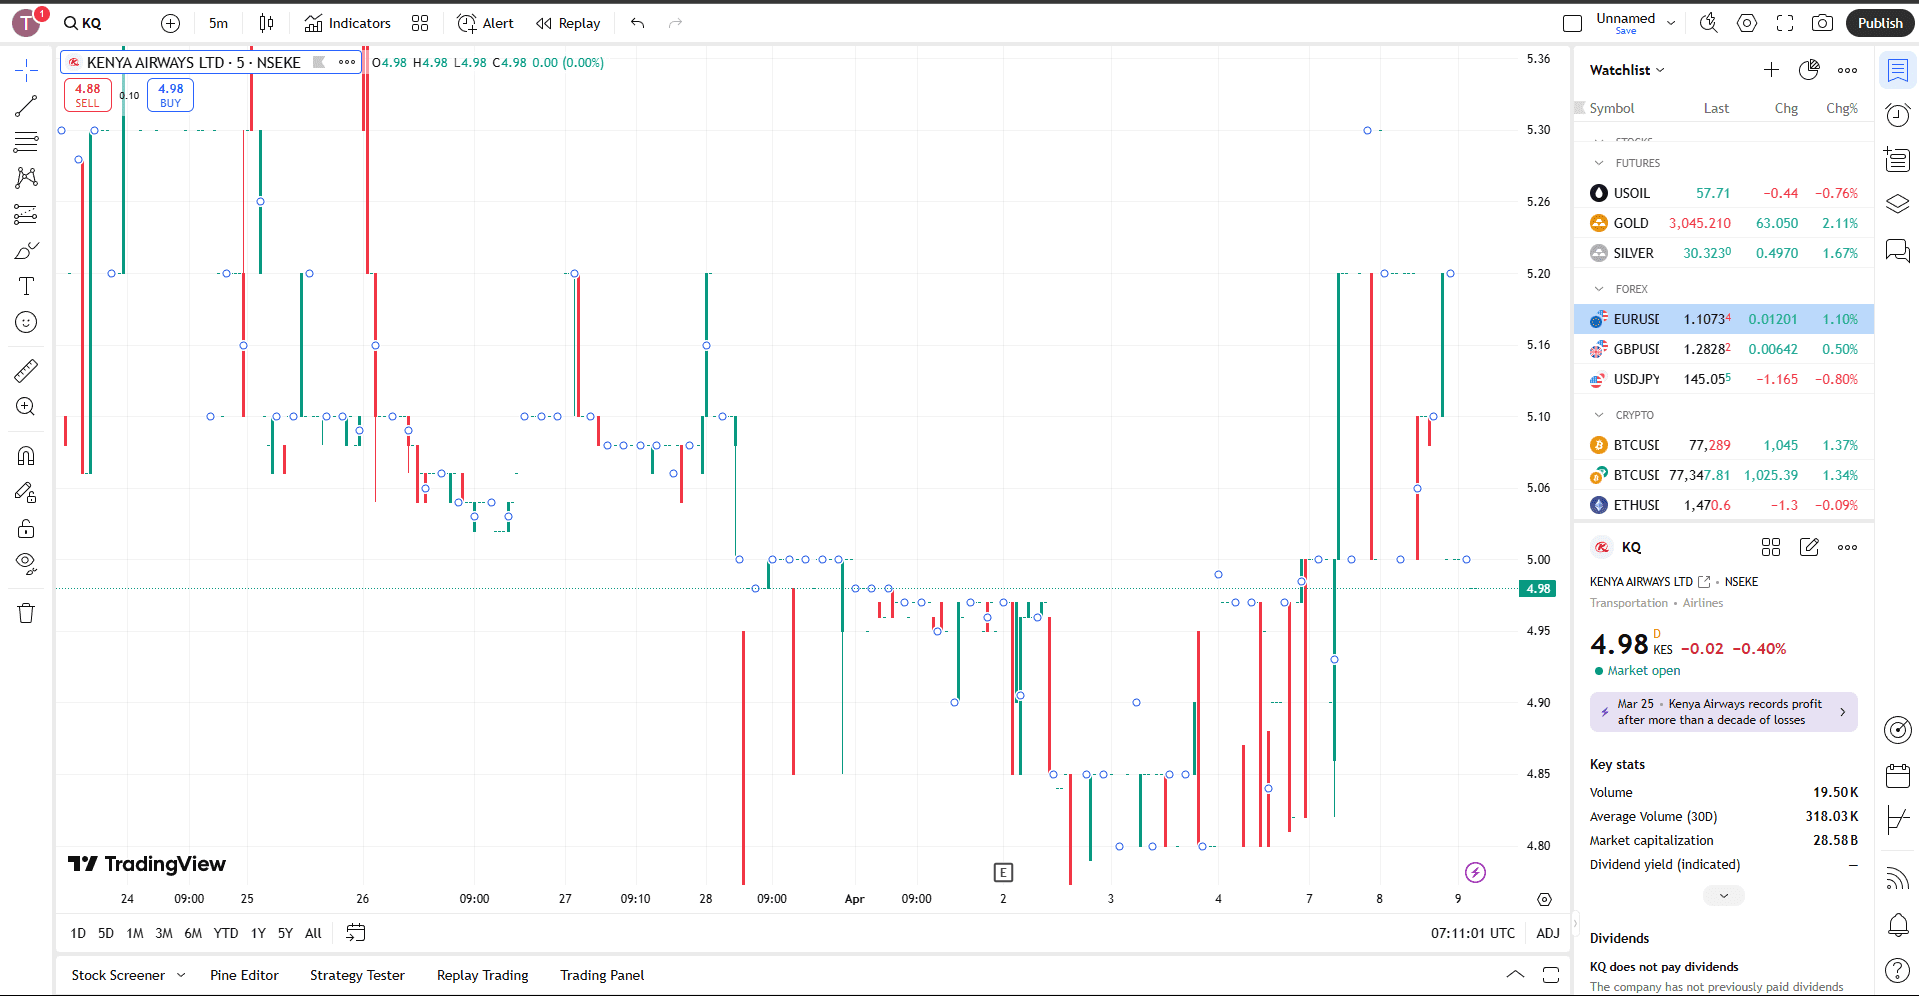
Navigating the TradingView Platform
The main chart window on TradingView consists of five key sections. The central area is the main chart display, where users can view the price movements of financial instruments.
-
The y-axis shows the price levels, which will differ based on the instrument selected.
-
The x-axis displays the date and time, which changes according to the chosen timeframe.
Top Toolbar: Charting Tools
The top toolbar contains several useful features for chart analysis:
-
Symbol Search: This feature allows users to search for specific financial instruments by typing in the name or ticker symbol. Since TradingView gathers real-time data from multiple brokers, you may see several options for the same instrument.
-
Compare or Add Symbol: Use this option to compare two instruments. After selecting another symbol, a new line (typically orange) will appear on the chart for comparison.
-
Timeframe: This tool allows users to change the timeframe of the chart (e.g., 5 minutes, 1 hour, daily, weekly), depending on the type of analysis required.
-
Chart Types: Users can switch between various chart styles such as candlestick, bar, line, Heikin Ashi, Renko, and more, to suit their analytical preference.
-
Indicators: TradingView offers a wide selection of technical indicators such as Moving Averages, RSI, MACD, and others. Users can also explore indicators created by the community using Pine Script.
-
Templates: These are pre-configured sets of indicators saved by other traders. Users can load, edit, or create their own templates for consistent analysis.
-
Alerts: Alerts can be set to notify users when the price reaches a specific level. You can configure conditions, names, and messages for the alert, or add one by clicking directly on the chart.
-
Bar Replay: This function lets you review historical price actions and test strategies by replaying past market movements.
-
Undo/Redo: These options help you reverse or restore changes made to the chart.
-
Layout Setup: Paid users can display multiple charts in one tab. Free users are limited to a single chart layout.
-
All Changes Saved: Free accounts allow saving only one layout. Multiple layouts require a paid subscription.
-
Quick Search: Enables fast access to any platform function or tool.
-
Chart Settings: Lets users personalize the chart’s appearance, including background color and candle colors.
-
Fullscreen Mode: Removes toolbars for a clearer view of the chart. Arrow keys allow easy navigation between instruments.
-
Take a Snapshot: Captures a screenshot of the current chart for personal use or sharing.
-
Publish: Traders can share their analysis by publishing it on the TradingView platform, along with a short title and description.
Right Toolbar: Community and Analysis Tools
This section includes various tools for analysis and community interaction:
-
Watchlist and Details: Displays a list of selected financial instruments. Users can add or remove items using the “+” or trash icons.
-
Alerts: Displays all active and triggered alerts set by the user.
-
Object Tree and Data Window: The Object Tree shows all current chart elements such as drawings and indicators. Switching to Data Window provides key data like open, high, low, close prices, percentage change, and volume.
-
My Ideas: Stores all published chart analyses for easy reference.
-
Chats: Offers access to public and private chat rooms where traders can share ideas and market discussions.
-
Ideas Stream: Shows real-time analyses and insights shared by other traders.
-
Screeners: Allows users to filter stocks, ETFs, or cryptocurrencies using criteria such as price, market cap, P/E ratio, and sector.
-
Calendars: Lists upcoming economic events like central bank decisions, earnings reports, and economic indicators (e.g., GDP, CPI, unemployment).
-
Help Centre: Provides answers to common questions, Pine Script support, and helpful articles.
Left Toolbar: Drawing Tools
This section contains tools for technical drawing and chart annotations:
-
Cursor Selection: Offers three cursor types—cross, dot, and arrow—and an eraser to remove drawings.
-
Trend Line Tools: Includes lines like horizontal, ray, and extended lines for marking support/resistance or trends.
-
Gann and Fibonacci Tools: Advanced tools for users applying strategies like Fibonacci retracement or Gann theory.
-
Patterns: Tools for identifying patterns such as triangles, head and shoulders, ABCD, and Elliott Waves.
-
Forecasting and Measurement Tools: Used to estimate future price moves and measure historical price or time ranges.
-
Geometric Shapes: Shapes like rectangles, circles, and triangles highlight key areas of interest.
-
Annotation Tools: Notes and labels can be added to the chart to record important information or thoughts.
-
Icons: A variety of emojis and symbols for personalizing the chart.
-
Measure Tool: Combines price and date ranges with volume data for accurate measurement.
-
Zoom In: Focuses on a specific area of the chart for detailed analysis.
-
Magnets: Snaps drawing tools to the nearest OHLC price level for more accurate positioning.
-
Stay in Drawing Mode: Keeps the same drawing tool active to avoid reselecting it each time.
-
Lock All Drawings: Prevents accidental changes to chart drawings.
-
Hide Options: Temporarily hides all indicators or drawings for a cleaner chart view.
-
Remove Options: Deletes specific indicators or drawing tools from the chart.
Bottom Toolbar: Advanced Tools
The bottom toolbar contains more specialized tools for analysis and trading:
-
Stock Screener: Similar to the right toolbar screener, but includes filters for forex pairs.
-
Pine Editor: TradingView’s scripting tool that allows users to create or modify indicators and strategies using Pine Script.
-
Strategy Tester: Lets users backtest strategies using historical data. Provides performance metrics like net profit, win rate, and drawdown.
-
Trading Panel: Allows connection with supported brokers to execute trades directly from the TradingView platform.
As a beginner in forex trading, all of this information may feel overwhelming at first. However, with consistent practice and proper guidance, it gradually becomes easier to understand. To help you get started on the right path, consider exploring our comprehensive forex trading training course.
How to Explore Kenyan Stocks on TradingView
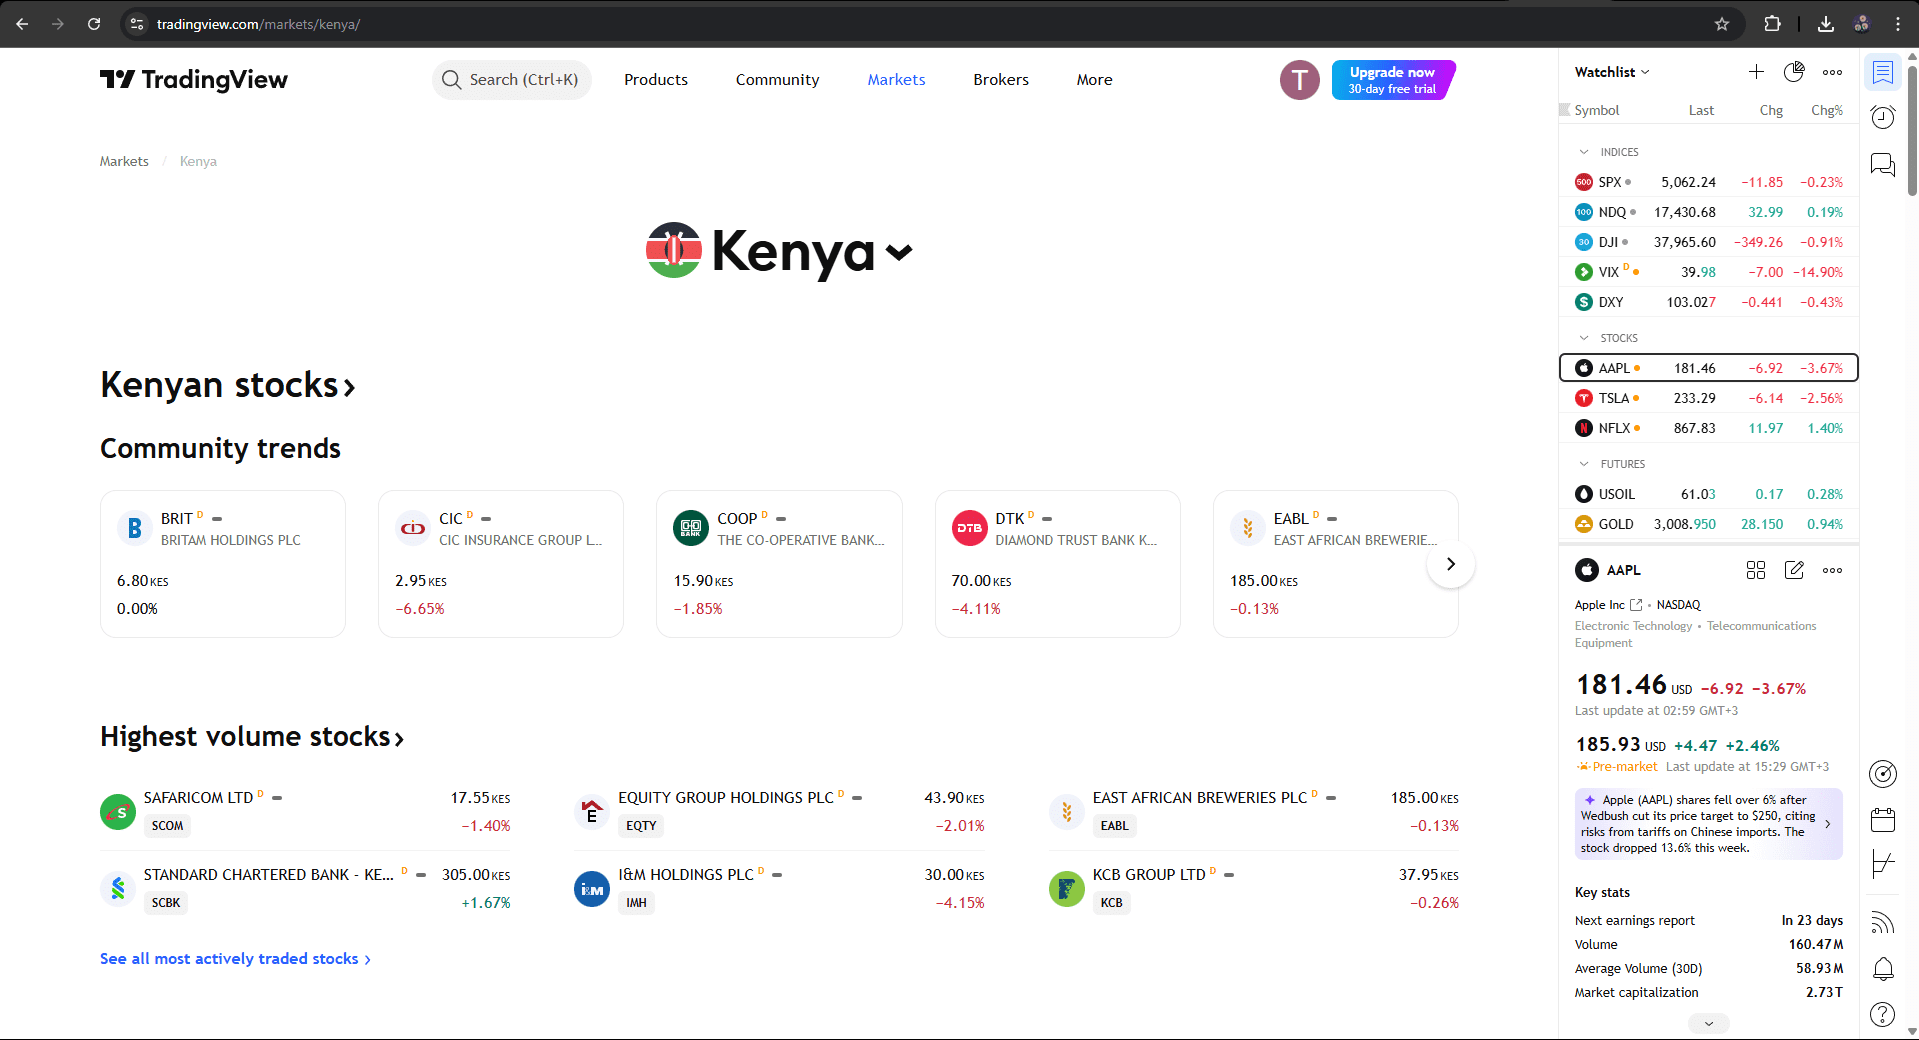
To explore Kenyan stocks on TradingView, start by navigating to the “Markets” tab at the top of the homepage. From there, go to “Countries and Regions” and select Kenya. This filters the content to display financial data relevant to the Kenyan market, including stocks, indices, forex pairs, and key economic indicators. Once you land on the Kenya market overview, you can dive into various asset classes such as Kenyan stocks, Kenyan forex pairs, and a summary of the country’s economic performance. Here, you’ll also find real-time data on the most active stocks in Kenya, helping you identify market trends and investor interests.
Under the “Stocks” section, TradingView lists all NSE-listed companies, such as Equity Bank (Equity Bank TradingView), Kenya Power (KPLC), Safaricom, EABL Kenya, KenGen, and BAT Kenya You can search for any of these by using their stock symbols, usually prefixed with NSE: (e.g., NSE:SCOM for Safaricom). Once selected, you’ll gain access to interactive price charts with tools for drawing trendlines, setting alerts, comparing historical performance, and applying technical indicators.
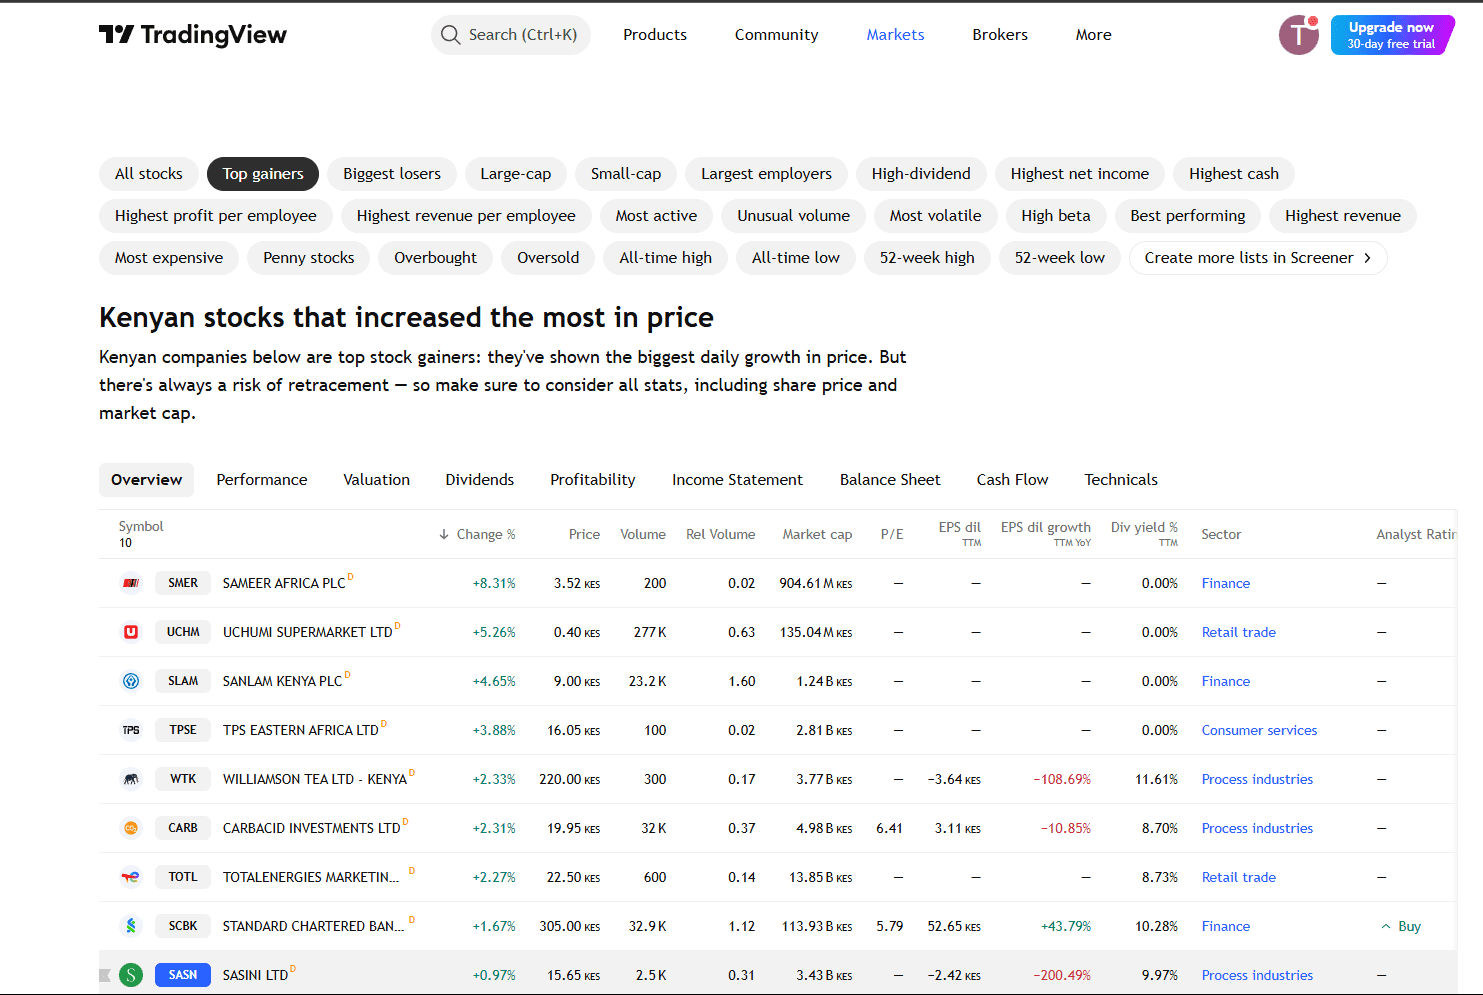
TradingView also allows users to filter stocks based on criteria like market cap, price performance, dividend yield, or P/E ratio, making it easier to perform both quick checks and deep technical analysis. Whether you’re a casual investor or a professional analyst, TradingView offers a user-friendly way to monitor and assess Kenya’s stock market with professional-grade tools—all in one place.
Connecting Your Forex Account to TradingView
One of TradingView’s most powerful features is its ability to connect with various forex brokers, enabling traders to execute trades directly from the charts.
To link a broker account, users simply need to log in to your account, open the trading panel at the bottom of the screen, and select their preferred broker from the list of supported platforms. After logging in to the broker account, trades can be placed directly from the chart interface, streamlining the trading process.
It’s important to note that not all brokers available on TradingView support Kenyan clients. Traders should verify their broker’s compatibility before attempting to connect their accounts. One of the forex brokers in Kenya compatible is FPMarkets. They have highlighted a full guide on how to link accounts.
Best Forex Brokers With TradingView In Kenya
-
Interactive Brokers: Renowned for its extensive range of products and extremely low fees, Interactive Brokers offers integration with TradingView, allowing clients to trade stocks, futures, and bonds across over 160 global markets. The platform provides access to a wealth of research tools, enhancing the trading experience.
-
IG: Recognized for its first-class web trading platform, IG supports TradingView integration, providing traders with superb educational tools and efficient deposit and withdrawal options. This combination ensures a user-friendly and resource-rich trading environment.
-
OANDA: Known for its great trading platforms and outstanding research tools, OANDA has completed its integration with TradingView, enabling clients to trade directly from TradingView charts. The account opening process is fast and user-friendly, further enhancing the trading experience.
-
IC Markets: Offering low forex fees and an easy, fast account opening process, IC Markets integrates with TradingView through its cTrader platform. This integration provides traders with advanced charting tools and technical analysis features.
-
Pepperstone: With a fast and fully digital account opening process, Pepperstone connects seamlessly with TradingView. Traders benefit from free deposits and withdrawals, as well as great educational materials, making it a suitable choice for both novice and experienced traders.
-
Eightcap: Known for its low forex fees and quick account setup, Eightcap offers integration with TradingView, allowing traders to access advanced charting tools and execute trades directly from the platform. The broker also provides free deposits and withdrawals, enhancing convenience for its clients.
These brokers combine robust trading platforms with TradingView’s advanced charting capabilities, offering Kenyan traders a comprehensive and efficient trading experience.
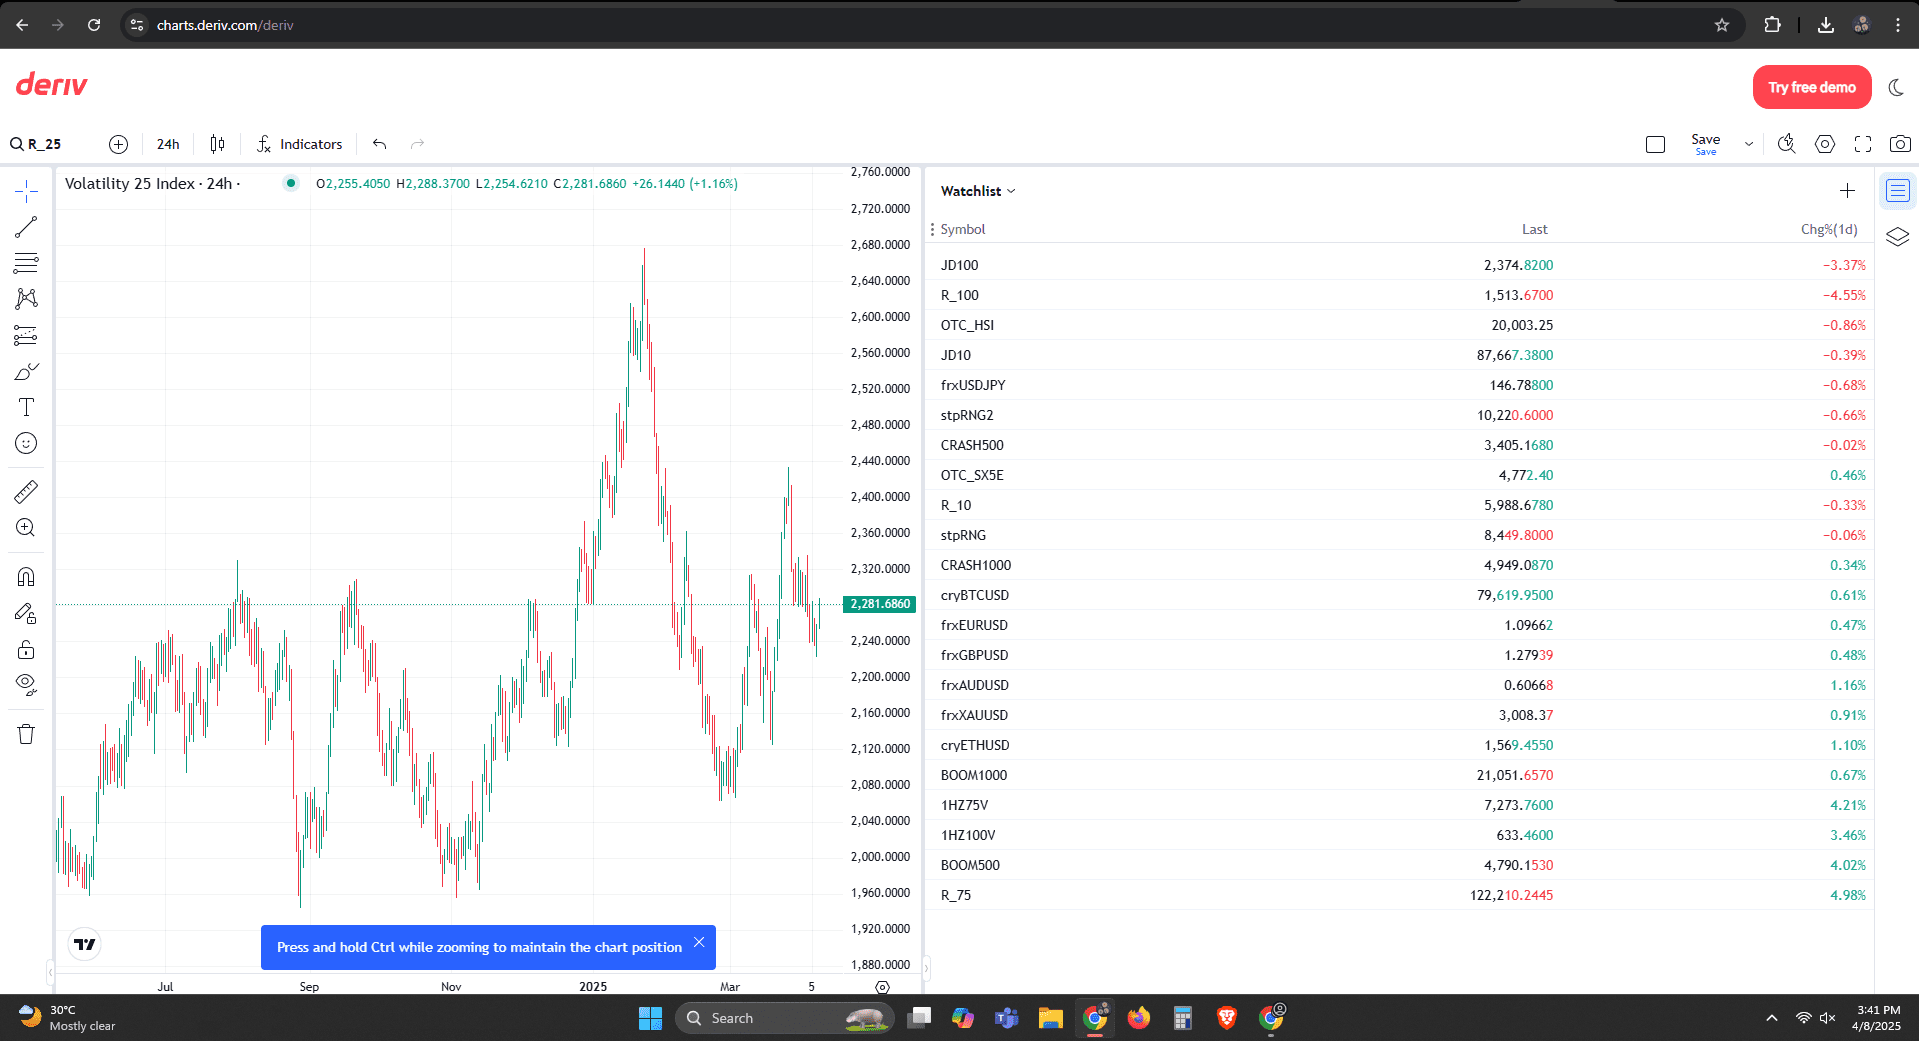
Deriv’s TradingView: A Customized Solution
Deriv, a popular broker among Kenyan traders, offers a customized version of TradingView tailored to its platform. While this integration provides seamless charting and trading, there are key differences between Deriv’s implementation and the standalone TradingView platform.
Deriv TradingView allows users to trade forex, cryptocurrencies, and binary options directly from the charts. However, it lacks some of the advanced features found in the full version, such as Pine Script for custom strategy development and access to social trading communities.
Additionally, Deriv’s version is limited to the assets available on its platform, meaning traders cannot analyze global stocks or indices unless they are offered by Deriv. Despite these limitations, the integration is a valuable tool for Deriv users, particularly those focused on binary options trading.
TradingView vs. Deriv’s TradingView: Which One Should Kenyan Traders Use?
The choice between the standalone TradingView platform and Deriv’s version depends on a trader’s specific needs and preferences.
TradingView is the better option for traders who require access to a wide range of markets, advanced analytical tools, and social trading features. Its flexibility and comprehensive asset coverage make it suitable for multi-market traders who need a one-stop solution for their analysis. The free version is however quite restricted. If you are an avid forex trader, you might find this as an inconvenience.
On the other hand, Deriv TradingView is more appropriate for traders who exclusively use Deriv as their broker, particularly those focused on forex and binary options. The seamless integration with Deriv’s trading platform offers convenience, albeit with fewer features compared to the full TradingView experience.
Final Recommendations for Kenyan Traders
For beginners, starting with the free plan is a practical way to familiarize oneself with the platform’s features. As trading activity increases, upgrading to a paid plan can provide the necessary tools for more sophisticated analysis.
Traders using Deriv should take advantage of its integrated TradingView charts for binary options and forex trading, while those needing broader market access should consider the standalone platform.
Ultimately, both versions offer unique benefits, and the best choice depends on individual trading goals and broker preferences. By understanding the strengths and limitations of each, Kenyan traders can make informed decisions to enhance their trading strategies.
Frequently Asked Questions
Can I trade binary options directly on TradingView?
No, TradingView does not support binary options trading natively. However, brokers like Deriv offer TradingView charts for binary options analysis and execution.
Is TradingView free for Kenyan traders?
Yes, the basic version is free, but it has limitations. Paid plans offer additional features for more active traders.
Which brokers can I connect to TradingView from Kenya?
Some supported brokers include Deriv, IC Markets, and Pepperstone. Traders should verify availability based on their location.
Does Deriv’s TradingView have all the features of the original platform?
No, Deriv’s version lacks certain features like Pine Script and social trading but is optimized for seamless trading on Deriv’s platform.
By leveraging TradingView’s powerful tools, Kenyan traders can gain a competitive edge in the markets. Whether using the standalone platform or Deriv’s integration, the key lies in selecting the option that best aligns with one’s trading style and objectives. Happy trading!